On June 15, we published the annual report for 2020. In it, the Board of Mars Pension Fund gives account to the members. This includes the policy pursued, financial results and, for example, administration costs. But the sustainability of the investment policy is also discussed. In short: a lot of information about how we are doing. Below are a few of the most important numbers.
Number of members
The number of members remained almost the same compared to last year.
| 2020 | 2019 | |
|---|---|---|
| Active | 1336 | 1388 |
| Former members | 1277 | 1267 |
| Pensioned members | 1373 | 1289 |
| Total | 3986 | 3944 |

Funding ratios
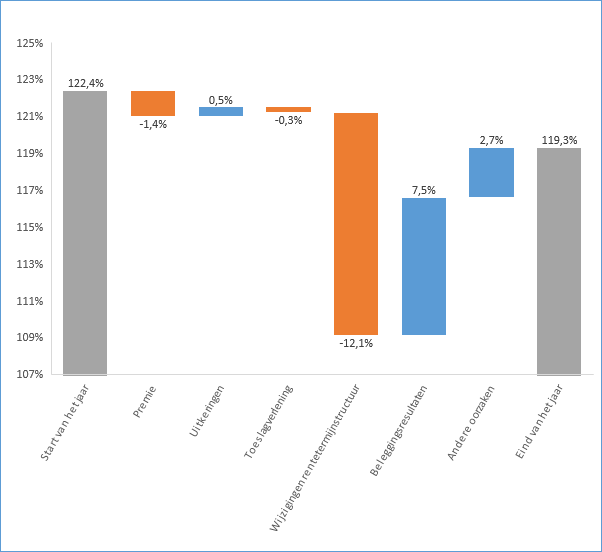
At the beginning of 2020, the current funding ratio was 122.4%. The chart below tells you which factors had an impact on the funding ratio in 2020. And how big that influence has been. As you can see, the changes in the interest rate term structure (-12.1%) had the biggest negative impact. Fortunately, this was offset by a more positive investment result (+7.5%). At the end of the year, the funding level ultimately came out at 119.3%.
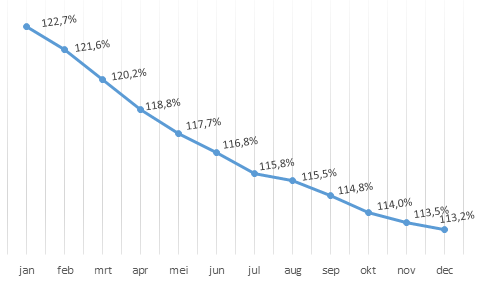
The policy funding ratio is the average of the current funding levels over the past 12 months. It therefore fluctuates less than the actual coverage ratio. The table shows how the policy coverage ratio developed in 2020. Ultimately, the policy funding ratio at the end of 2020 was 113.2%.
Finances
In 2020, our total pension assets were 287 million euros. That's 19 million less than last year. Here's how: our income in 2020 amounted to about 21 million euros in contributions. In addition, our investments generated 119 million euros. Over the whole year, we achieved a return on our investments of 7%. Over the past 10 years, our average annual return has been 7.9%. Premiums and investment income added together, therefore, we have a total income of 140 million. On the other hand, our expenses include pension payments (35 million), implementation and administration costs (3 million) and movements in the pension provision (100 million).
| 2020 | 2019 | |
|---|---|---|
| Pension assets | 287 million | 306 million |
| Loss/profit | -19 million | -4,3 million |
| Investment results | 119 million | 197 million |
Movements in the pension provision include the pension accrual of members (21 million), but also the changes in the so-called "interest rate term structure". In the chart above, this also had a significant effect on the funding level in 2020. The term structure of interest rates, which is published by the Dutch Central Bank, is a percentage that reflects the interest rate we have to charge. Changes in this interest rate can be a major cost item for us. This is also the case in 2020: 151 million euros. If you add all the costs together, you arrive at 158 million euros. That means 19 million euros less than last year.
In the full annual report you will find much more. Think for example of our organizational structure, more financial information, our (sustainable) investment strategy, and market developments. Our annual report can be downloaded from our website and is freely available to everyone.